
One number, one definition, one place to find it.
Most reporting problems are not visualisation problems. They are the result of four teams each calculating revenue slightly differently, which means every meeting starts by arguing about whose figure is right.
The dashboard is fine. Nobody believes it.
Organisations rarely lack reports. They have hundreds, built over years by different people against different sources, each defensible on its own and none of them reconciling with the others.
The consequence is that decisions get made from whichever number the person in the room trusts, and analysts spend their week explaining differences, not finding anything new.
The fix is unglamorous and it is not a new tool. It is a governed semantic layer: one certified definition of each core metric, owned by a named person, with reports built on top of it, not beside it.
Once that exists, the visualisation layer becomes easy, and machine learning becomes possible, because models need consistent, documented, historically reliable inputs far more than they need clever algorithms.
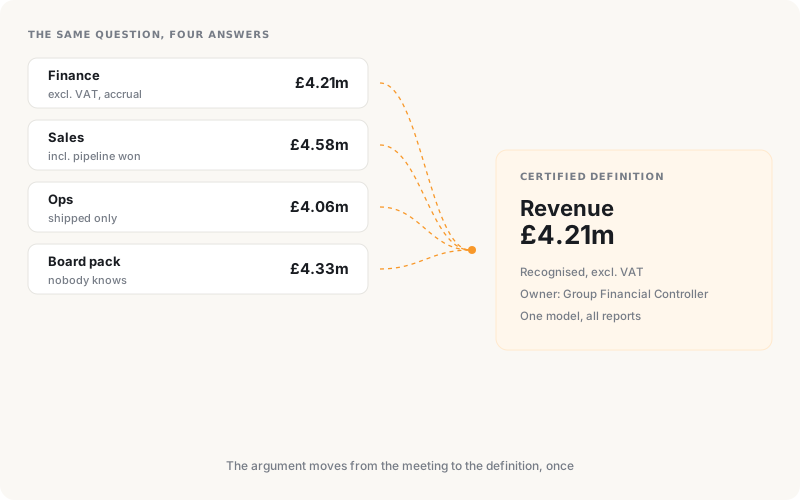
The same question, four answers.
Each of those four numbers is defensible on its own. Finance is right about accrual, sales is right about what closed, operations is right about what shipped. None of them reconciles with the others, so every meeting begins by relitigating the figure.
Agreeing one certified definition with a named owner is unglamorous, takes a fortnight of workshops, and is the single highest-return thing most reporting programmes can do. The dashboards afterwards are the easy part.
Power BI, Tableau and the model underneath them.
We deliver in both Power BI and Tableau and have migrated clients in each direction. The tool is far less important than what sits beneath it: a certified model, clear ownership, and a small number of reports that people open.
The most common request we receive is a new dashboard. The most common thing we recommend is retiring forty of the existing ones, because report sprawl is itself a major cause of the trust problem.
- Semantic models with certified metrics — one definition of revenue, margin and volume that everything reports against.
- Report and dashboard design — built to answer a specific decision rather than to display everything available.
- Row-level security — aligned to your existing groups, so access does not need separate maintenance.
- Power Apps and Power Automate — where people need to act on what the report shows, not just read it.
- Report rationalisation — inventory what exists, find what nobody opens, and retire it deliberately.
- Training and enablement, so your analysts extend the model themselves, not raising a ticket.
Six pieces of the platform beneath the reports.
None of this is visible to the business, and all of it determines whether the visible part can be trusted.
Warehouse & lakehouse design
A modelled destination for data instead of a landing area that gradually becomes one by accident.
Snowflake · BigQuery · Synapse · PostgresPipelines & orchestration
Scheduled, monitored, restartable ingestion, not notebooks run when somebody remembers.
Airflow · dbt · Data FactoryData quality & reconciliation
Automated checks that catch a broken feed before it reaches a board pack.
Validation · alerting · lineageForecasting & prediction
Demand, churn, capacity and risk models where a trained model beats a rule.
Python · scikit-learn · PyTorchAnomaly & exception detection
Surfacing the transactions that do not look like the others, for fraud, error and operational monitoring.
Statistical · ML-basedEmbedded analytics
Reporting inside your own product or portal, not in a separate tool nobody logs into.
Embedded BI · APIsData and reporting technologies we work in.
Microsoft & BI
Power BI, Power Apps, Power Automate and Tableau.
Databases & processing
The stores and pipelines beneath the reporting.
AI & ML
Where prediction adds something a report cannot.
Definitions first. Dashboards last.
-
Weeks 1–2
Audit what exists
Which reports exist, who opens them, which sources they use and where they disagree. The inventory alone usually surprises people.
-
Weeks 3–4
Agree the definitions
Workshops to settle what each core metric means and to assign a named owner to it. This is the step that fixes the trust problem, and it is not a technical step.
-
Weeks 5–9
Build the model
Pipelines, warehouse and semantic layer with quality checks throughout, so reports and models can both rely on the same numbers.
-
Weeks 9–12
Report, then retire
A small number of dashboards built on the model, and formal retirement of the old ones, which matters as much as building the new.
-
Ongoing
Extend and enable
New domains, predictive models and training so your analysts extend it themselves, with a quarterly review of usage and what to retire next.
Before you commission another dashboard.
The three below are the ones this page does not already answer. Anything more specific, put it to us directly.
Our data is not clean enough for this. Should we fix that first?
Not as a separate project, no. A data quality programme with no consumer tends to run for a year and produce a cleaner version of data nobody is using, because without a specific report or model depending on it there is no forcing function for what “clean enough” means. The approach that works is to pick one important domain, build the pipeline and the model for it, and let the quality problems surface as concrete, prioritised defects with a business consequence attached. Fixing the seven issues that break your revenue reporting is achievable; fixing everything is not.
Power BI or Tableau?
Usually whichever your organisation is already licensed for and skilled in, because the capability gap between them is far narrower than the cost of a migration. Power BI is normally the better economics inside a Microsoft estate, integrates naturally with Entra ID and the Power Platform, and has a stronger governed-model story. Tableau tends to be preferred by analyst-heavy teams who value exploratory freedom. We deliver both and have migrated in each direction, so we have no stake in the answer. What we would push back on is running both long-term without a clear split, which doubles the governance work and reliably reintroduces the conflicting-numbers problem.
Do we need machine learning, or is reporting enough?
Reporting is enough far more often than the market suggests. Reporting tells you what happened; machine learning is worth adding when a prediction would change a decision you make repeatedly and at volume, which stock to hold, which customer is about to leave, which transaction to review. The prerequisites are consistent historical data, a decision that is genuinely repeated, and a measurable outcome to check the model against. Where those are absent, a clear report and a simple rule will outperform a model and cost a fraction as much to run. We will tell you which situation you are in.